How STPP is Made: Exploring Sodium Tripolyphosphate Manufacturing Via Google Patents and Phosphoric Acid Chemistry
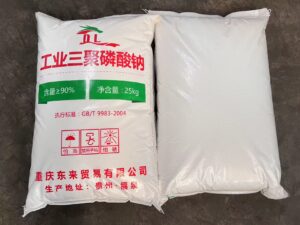
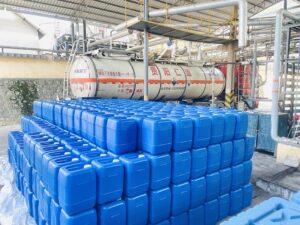
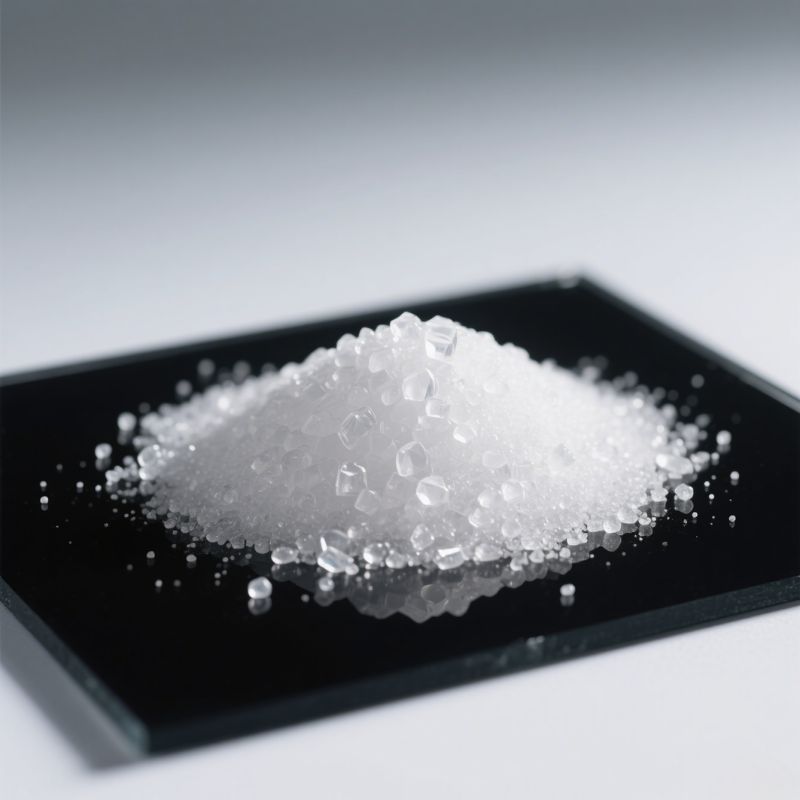
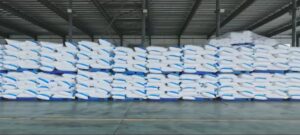
Sodium tripolyphosphate (STPP) is manufactured through controlled reactions of phosphoric acid and sodium compounds, with patented industrial processes optimizing purity and yield.